Filtering bad, sampling good
This post gives an example on how to use adaptive sampling instead of filtering on “noisy” telemetry and explains the benefits of this approach.
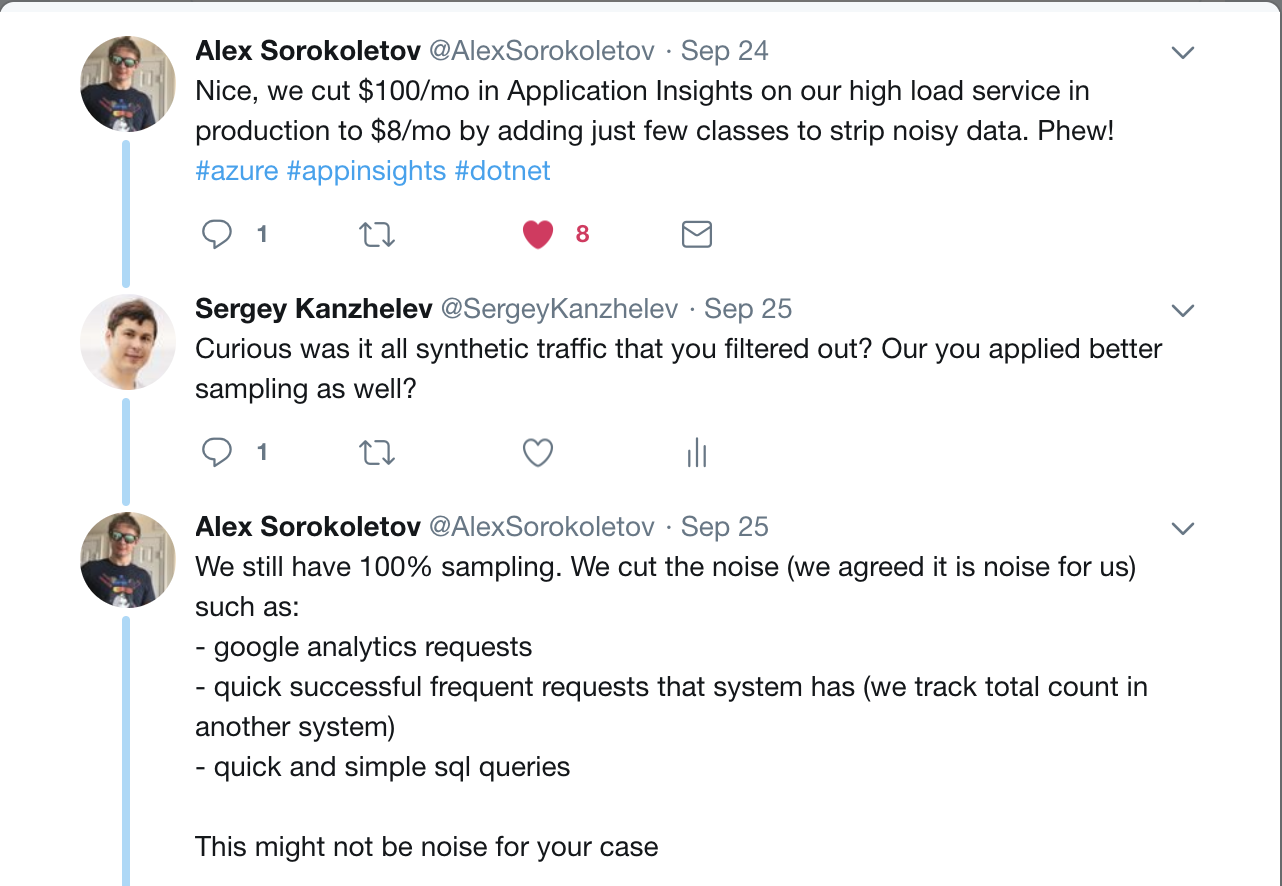
The idea of this post comes as a result of two conversations. First, on twitter on how to filter out fast requests and dependency calls:
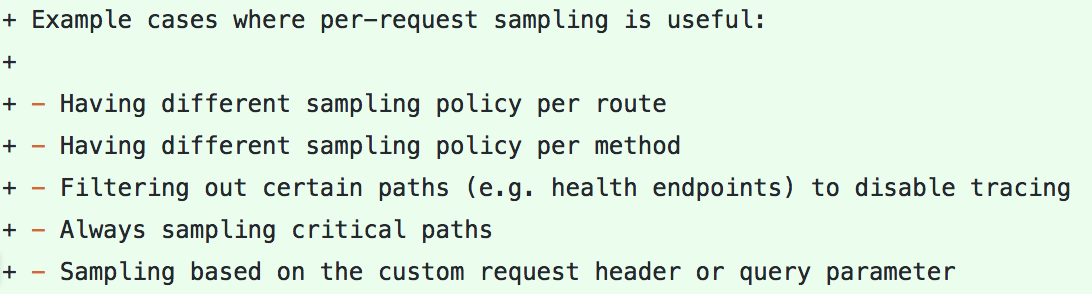
Second one is a design discussion on sampling per endpoint url path for Open Census:
I’ll give example in C# as this post adds a scenario to the msdn article. The same techniques can be used on any other language supported by Application Insights.
Idea
Application Insights collects information in form of C# object
RequestTelemetry and DependencyTelemetry about every incoming and outgoing
call to your app. This object is passed to the
processing pipeline
that will enrich it with an additional details or filter it out. This
approach requires to allocate an object and populate its properties for every
request, but it makes writing filters a straightforward task.
Let’s implement a processor which aggressively samples fast incoming and
outgoing calls. First, let’s filter out fast incoming requests. Processor is a
class inherited from the interface ITelemetryProcessor. This class should have
a constructor that takes another ITelemetryProcessor as an argument. When
pipeline will be instantiated - constructor will be called and the next
processor will be passed as a parameter. In a Process method then processor
decides whether to call next.Process. If it will be called - the next
processor will decide whether to pass an item further. If next.Process will
not be called - telemetry object will be lost.
The idea is to create a new AdaptiveSamplingTelemetryProcessor (which is one
of a standard processors) and pass next to its constructor. So that processor
will decide what to do with this telemetry object - either filter it our or pass
it to the next.
Basically, there will be fork for all telemetry - fast calls will go thru the
aggressive sampling processor. Slow calls - directly to the next one.
Implementation
This is how code will look like:
internal class AggressivelySampleFastRequests : ITelemetryProcessor
{
  private readonly ITelemetryProcessor next;

  private readonly AdaptiveSamplingTelemetryProcessor samplingProcessor;

  public AggressivelySampleFastRequests(ITelemetryProcessor next)
  {
    this.next = next;
    this.samplingProcessor = new AdaptiveSamplingTelemetryProcessor(this.next);
  }

  public void Process(ITelemetry item)
  {
    // check the telemetry type and duration
    if (item is RequestTelemetry)
    {
      var d = item as RequestTelemetry;
      if (d.Duration < TimeSpan.FromMilliseconds(500))
      {
        // let sampling processor decide what to do
        // with this fast incoming request
        this.samplingProcessor.Process(item);
        return;
      }
    }

    // in all other cases simply call next
    this.next.Process(item);
  }
}
Further customization of a processor might include adjusting
AdaptiveSamplingTelemetryProcessor parameters like this:
this.samplingProcessor = new AdaptiveSamplingTelemetryProcessor(this.next)
{
    ExcludedTypes = "Event", // exclude custom events from being sampled
    MaxTelemetryItemsPerSecond = 1, // default: 5 calls/sec
    SamplingPercentageIncreaseTimeout = TimeSpan.FromSeconds(1), // default: 2 min
    SamplingPercentageDecreaseTimeout = TimeSpan.FromSeconds(1), // default: 30 sec
    EvaluationInterval = TimeSpan.FromSeconds(1), // default: 15 sec
    InitialSamplingPercentage = 25, // default: 100%
};
And making threshold TimeSpan.FromMilliseconds(500) configurable.
Similar code can be implemented for outgoing calls processing. And those two processors can be chained together:
configuration.TelemetryProcessorChainBuilder
    .Use((next) => { return new AggressivelySampleFastRequests(next); })
    .Use((next) => { return new AggressivelySampleFastDependencies(next); })
    .Build();
Interestingly you can chain those two processors with the regular adaptive
sampling processor. Fast calls will not be processed by final
AdaptiveSamplingTelemetryProcessor as they will already be marked as
sampled-in. Only slow requests and slow dependencies will be analyzed by the
global processor.
configuration.TelemetryProcessorChainBuilder
    .Use((next) => { return new AggressivelySampleFastRequests(next); })
    .Use((next) => { return new AggressivelySampleFastDependencies(next); })
    .Use((next) => { return new AdaptiveSamplingTelemetryProcessor(next); })
    .Build();
Results and benefits
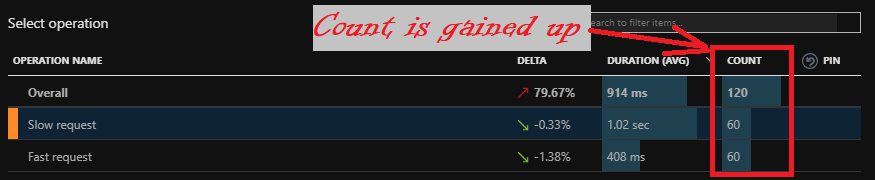
So how the collected telemetry will look like? To illustrate it, I’d assume that fast requests and fast dependencies processors only preserved 5% of telemetry representing fast calls and global sampler preserved 20% of telemetry. I included this demo into Azure-Samples repository.
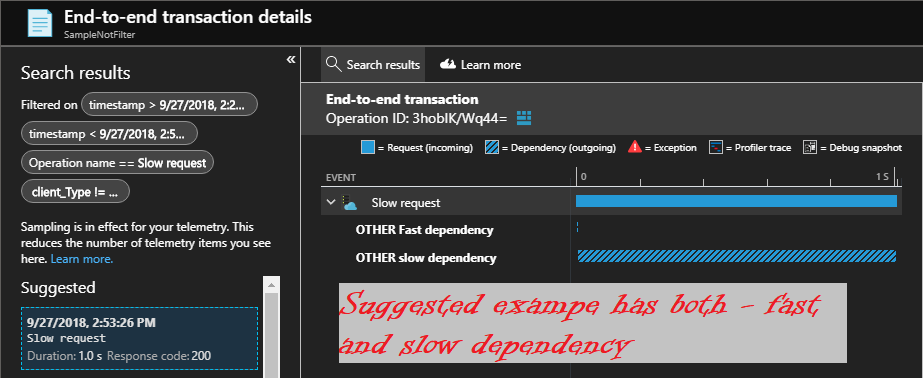
When you will analyze telemetry for this app, you will probably start with slow requests. You will find that all collected incoming requests have information about all slow outgoing calls. You may also discover that while browsing Azure portal in many cases you will see examples of slow incoming requests with both - slow and fast requests collected.
The reason for this is that adaptive sampling is using probability sampling algorithm to decide on sampling decision. If sampling score is lower than 20% - slow request and dependencies will be collected. Is sampling score is lower than 5% - fast dependencies will also be collected.
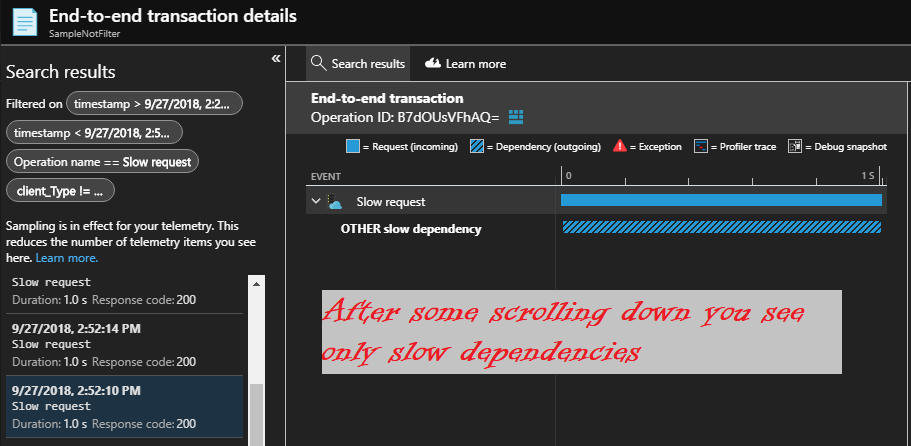
Azure portal highlights examples with lowest sampling score as the most interesting to analyze. This is why you will get many useful samples with all the details. When you scroll down or randomly will open examples - you will see many of them with slow dependency only collected.
In a given conditions all collected fast requests will have the details on all the fast dependency calls. Again, browsing those may be useful.
Here I should note that end-to-end transaction view that spans across many components will follow the same principles. If sampling percentages of collected telemetry generally the same and algorithms on deciding on cohorts (thresholds to decide slow vs. fast) is similar - there always would be examples of end-to-end execution. I might write more about it the next time.
There are many other benefits on aggressive sampling versus filtering than preserving 5% of end-to-end transaction views.
Application map will be more complete. With filtering out fast dependencies, you may filter out knowledge about the entire service you depend on if it runs fast.
Endpoint url path will be discoverable on performance page in Azure portal. You will be able to catch problems with major performance degradation of those. If calls that used to take 10 ms will start taking 200 ms - this change will be visible on chart even on 5% of telemetry. And it will likely be caught by smart detectors of Application Insights.
Latency problems caused by multiple calls to the fast dependent service will be caught - there probably be examples of those in the collected 5%.
Summary
ROI of monitoring is not a simple topic. You can collect tons of logs and traces and have no clue when something goes wrong. Or a single trace may give you information on root cause of a major app slowdown. Every time you filter out telemetry - you are loosing a signal that might have saved your day.
Application Insights allows a lot of flexibility in data processing configuration. So you can save on COGS and preserve some of the signal. Use it!
Comments
comments powered by Disqus