Two types of correlation
Application Map in Application Insights supports two types of correlation. One shows nodes in the map as instrumentation keys and another - as roles inside a single instrumentation key. The plan is to combine them. In this post, I explain why there are two separate maps today and how Application Map is built from telemetry events.
Single instrumentation key Application Map
Application Insights data model defines incoming requests and outgoing dependency calls. When SDK collects these events - it populates request’s source field and dependency’s target. Now it’s easy to draw an Application Map in a form of a star. Application is in the center of the star and every node it connected to describes the source of incoming request or target or outgoing. These two queries show how to do it:
dependencies | summarize sum(itemCount) by target
requests | summarize sum(itemCount) by source
When you have an Application Map is in a form of a star, you may notice that some http dependency calls are actually the calls to another component of your application. If both components send data to the same instrumentation key you can easily follow this call by joining telemetry. Dependency call of component A has an id matching the parentId of incoming request of component B. Typically those components will de deployed separately and would have a different cloud_roleName field. So by running this query you get the list of all components (defined as cloud_roleName) talking to each other:
dependencies
  | join requests on $left.id == $right.operation_ParentId
  | summarize sum(itemCount) by from = cloud_RoleName, to = cloud_RoleName1
This query joins outgoing from component A dependency call to the request incoming to the component B. Now you can see a map where every node is a separate cloud_RoleName. Note, that some of dependency calls are made to external components. To draw those you’d still need to use a target field from before. With the slight modification - you need to group it by cloud_roleName:
dependencies | summarize sum(itemCount) by from = cloud_RoleName, to = target
This example shows how to build an application map from code. First - define some constants:
string SINGLE_INSTRUMENTATION_KEY = "3b162b68-47d7-4a8c-b031-c246206696e3";
var TRACE_ID = Guid.NewGuid().ToString();
First component - let’s call it Frontend reports RequestTelemetry and related DependencyTelemetry. Both define the .Cloud.RoleName context property to identify the component.
var r = new RequestTelemetry(
    name: "PostFeedback",
    startTime: DateTimeOffset.Now,
    duration: TimeSpan.FromSeconds(1),
    responseCode: "200",
    success: true)
{
    Source = "" //no source specified
};
r.Context.Operation.Id = TRACE_ID; // initiate the logical operation ID (trace id)
r.Context.Operation.ParentId = null; // this is the first span in a trace
r.Context.Cloud.RoleName = "Frontend"; // this is the name of the node on app map

new TelemetryClient() { InstrumentationKey = SINGLE_INSTRUMENTATION_KEY }.TrackRequest(r);

var d = new DependencyTelemetry(
    dependencyTypeName: "Http",
    target: $"myapi.com", //host name
    dependencyName: "POST /feedback",
    data: "https://myapi.com/feedback/text='feedback text'",
    startTime: DateTimeOffset.Now,
    duration: TimeSpan.FromSeconds(1),
    resultCode: "200",
    success: true);
d.Context.Operation.ParentId = r.Id;
d.Context.Operation.Id = TRACE_ID;
d.Context.Cloud.RoleName = "Frontend"; // this is the name of the node on app map

new TelemetryClient() { InstrumentationKey = SINGLE_INSTRUMENTATION_KEY }.TrackDependency(d);
Frontend component needs to pass global trace ID Context.Operation.Id and dependency call ID d.Id to the next component. Typically those identities are sent via http header.
Component called API Service tracks incoming request and instantiates context properties .Context.Operation.ParentId and .Context.Operation.Id from the incoming request headers. These context properties allow to join dependency call from Frontend to request in API Service.
In this example API Service in turn calls the external API.
r = new RequestTelemetry(
    name: "POST /feedback",
    startTime: DateTimeOffset.Now,
    duration: TimeSpan.FromSeconds(1),
    responseCode: "200",
    success: true)
{
    Url = new Uri("https://myapi.com/feedback/text='feedback text'")
};
r.Context.Operation.Id = TRACE_ID; // received from http header
r.Context.Operation.ParentId = d.Id; // received from http header
r.Context.Cloud.RoleName = "API Service"; // this is the name of the node on app map

new TelemetryClient() { InstrumentationKey = SINGLE_INSTRUMENTATION_KEY }.TrackRequest(r);

d = new DependencyTelemetry(
    dependencyTypeName: "http",
    target: $"api.twitter.com",
    dependencyName: "POST /twit",
    data: "https://api.twitter.com/twit",
    startTime: DateTimeOffset.Now,
    duration: TimeSpan.FromSeconds(1),
    resultCode: "200",
    success: true);
d.Context.Operation.ParentId = r.Id;
d.Context.Operation.Id = TRACE_ID;
d.Context.Cloud.RoleName = "API Service"; // this is the name of the node on app map

new TelemetryClient() { InstrumentationKey = SINGLE_INSTRUMENTATION_KEY }.Track(d);
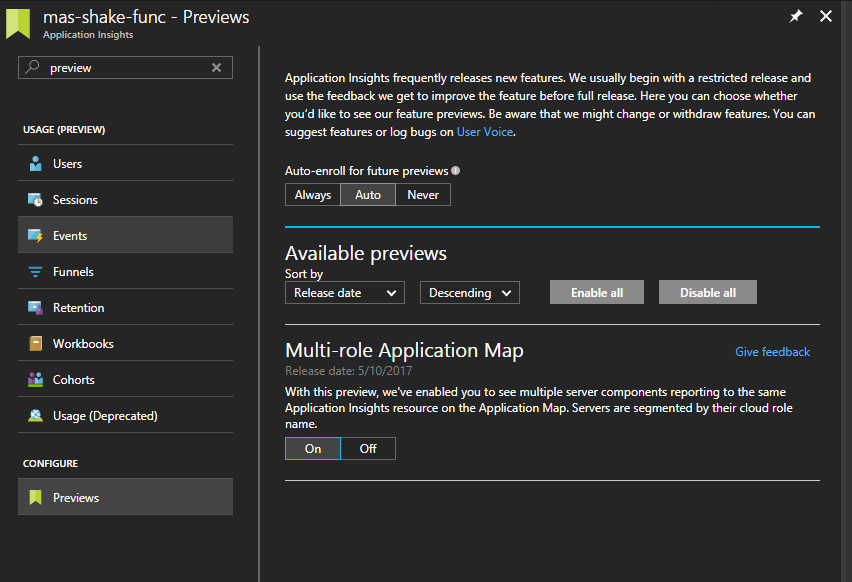
Multi-role Application Map is in preview now. So in order to see it you’d need to enable it as shown on the picture:
Result of the code execution looks something like this picture:
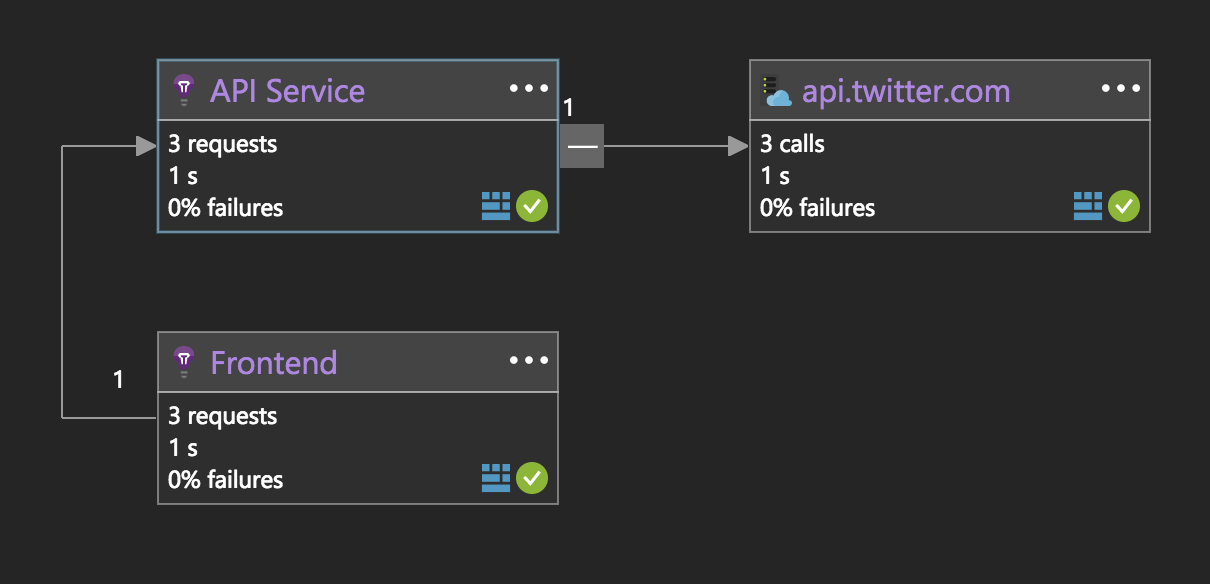
You can see that every component of your application is represented as a separate node on Application Map. However an important limitation of this approach is that it only works when every component uses the same instrumentation key. The main reason for this limitation is that Application Insights did not support cross applications joins for long time.
Application Insights supports cross instrumentation key queries now, but joins across components are still expensive. Join-based approach may still fall apart. First, you never know in advance which instrumentation keys you need to join across. Second, rare calls may be easily sampled out when the load of telemetry is high.
Cross instrumentation key Application Map
In order to solve problems of join-based Application Map, components need to exchange an identity information. So component A shares its identity when send request to component B. And component B replying with its identity.
This approach is used for the cross instrumentation key application map. This diagram shows how:
- Component A sends its Application Insights identity with request…
- … and expect the target component B to send its identity back
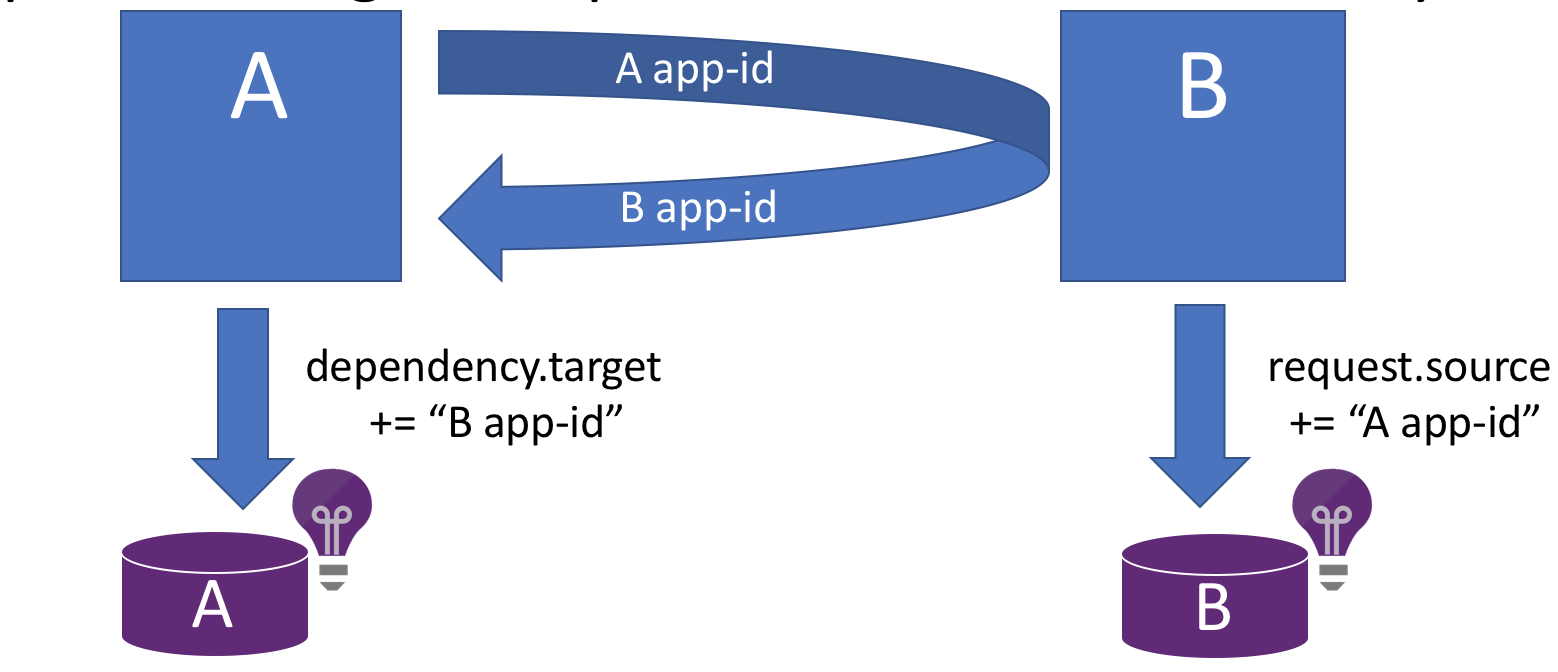
Knowing identity of the component allows to pre-aggregate metrics and make sure that even rare calls to a certain dependent component are not sampled out.
This example shows how it works in code. First, define two separate instrumentation keys:
string FRONTEND_INSTRUMENTATION_KEY = "fe782703-16ea-46a8-933d-1769817c038a";
string API_SERVICE_INSTRUMENTATION_KEY = "2a42641e-2019-423a-a2b5-ecab34d5477d";
Next step is to get the app-id for each instrumentation key. Exposing instrumentation key to dependant services is not a good practice as it can be used to spoof telemetry. app-id identifies component, but cannot be used to submit telemetry to Application Insights.
// Obtaining APP ID for these instrumentation keys.
// We are using app ID for correlation as propagating it via HTTP boundaries do not expose the instrumentation key, but still
// uniquely identifies the Application Insights resource
var task = new HttpClient().GetStringAsync($"https://dc.services.visualstudio.com/api/profiles/{FRONTEND_INSTRUMENTATION_KEY}/appId");
task.Wait();
var FRONTEND_APP_ID = task.Result;

task = new HttpClient().GetStringAsync($"https://dc.services.visualstudio.com/api/profiles/{API_SERVICE_INSTRUMENTATION_KEY}/appId");
task.Wait();
var API_SERVICE_APP_ID = task.Result;
Sending the Request and dependency calls from the first component. Note, that dependency now initializes Target field with additional information. API Service component returned its app-id in the http response so the Frontend component can associate it with the dependency telemetry.
var TRACE_ID = Guid.NewGuid().ToString();


//Frontend initiates a logical operation
var r = new RequestTelemetry(
    name: "PostFeedback", //this is the name of the operation that initiated the entire distributed trace
    startTime: DateTimeOffset.Now,
    duration: TimeSpan.FromSeconds(1),
    responseCode: "200",
    success: true)
{
    Source = "", //no source specified
    Url = null, // you can omit it if you do not use it
};
r.Context.Operation.Id = TRACE_ID; // initiate the logical operation ID (trace id)
r.Context.Operation.ParentId = null; // this is the first span in a trace

new TelemetryClient() { InstrumentationKey = FRONTEND_INSTRUMENTATION_KEY }.TrackRequest(r);

// Frontend calls into API service. For http communication we expect that response will have a header:
// Request-Context: appId={MAS_SHAKE_APP_ID}
var d = new DependencyTelemetry(
    dependencyTypeName: "Http (tracked component)", //(tracked component) indicates that we recieved response header Request-Context
    target: $"myapi.com | cid-v1:{API_SERVICE_APP_ID}", //host name, | char and app ID from the response headers if available
    dependencyName: "POST /feedback",
    data: "https://myapi.com/feedback/text='feedback text'",
    startTime: DateTimeOffset.Now,
    duration: TimeSpan.FromSeconds(1),
    resultCode: "200",
    success: true);
d.Context.Operation.ParentId = r.Id;
d.Context.Operation.Id = TRACE_ID;


new TelemetryClient() { InstrumentationKey = FRONTEND_INSTRUMENTATION_KEY }.TrackDependency(d);
Component API Service also reports request and dependency telemetry. Note, that request telemetry has an identity of Frontend in the Source field.
// The following headers got propagated with the http request
//  Request-Id: |<r.Id>
//  Request-Context: appId=cid-v1:{DEVICES_APP_ID}
//

//Request got received by API service:

r = new RequestTelemetry(
    name: "POST /feedback", //this is the name of the operation that initiated the entire distributed trace
    startTime: DateTimeOffset.Now,
    duration: TimeSpan.FromSeconds(1),
    responseCode: "200",
    success: true)
{
    Source = $" | cid-v1:{FRONTEND_APP_ID}", // this is the value from the request headers
    Url = new Uri("https://myapi.com/feedback/text='feedback text'"), // you can omit it if you do not use it
};
r.Context.Operation.Id = TRACE_ID; // initiate the logical operation ID (trace id)
r.Context.Operation.ParentId = d.Id; // this is the first span in a trace

new TelemetryClient() { InstrumentationKey = API_SERVICE_INSTRUMENTATION_KEY }.TrackRequest(r);

d = new DependencyTelemetry(
    dependencyTypeName: "http",
    target: $"api.twitter.com",
    dependencyName: "POST /twit",
    data: "https://api.twitter.com/twit",
    startTime: DateTimeOffset.Now,
    duration: TimeSpan.FromSeconds(1),
    resultCode: "200",
    success: true);
d.Context.Operation.ParentId = r.Id;
d.Context.Operation.Id = TRACE_ID;

new TelemetryClient() { InstrumentationKey = API_SERVICE_INSTRUMENTATION_KEY }.Track(d);
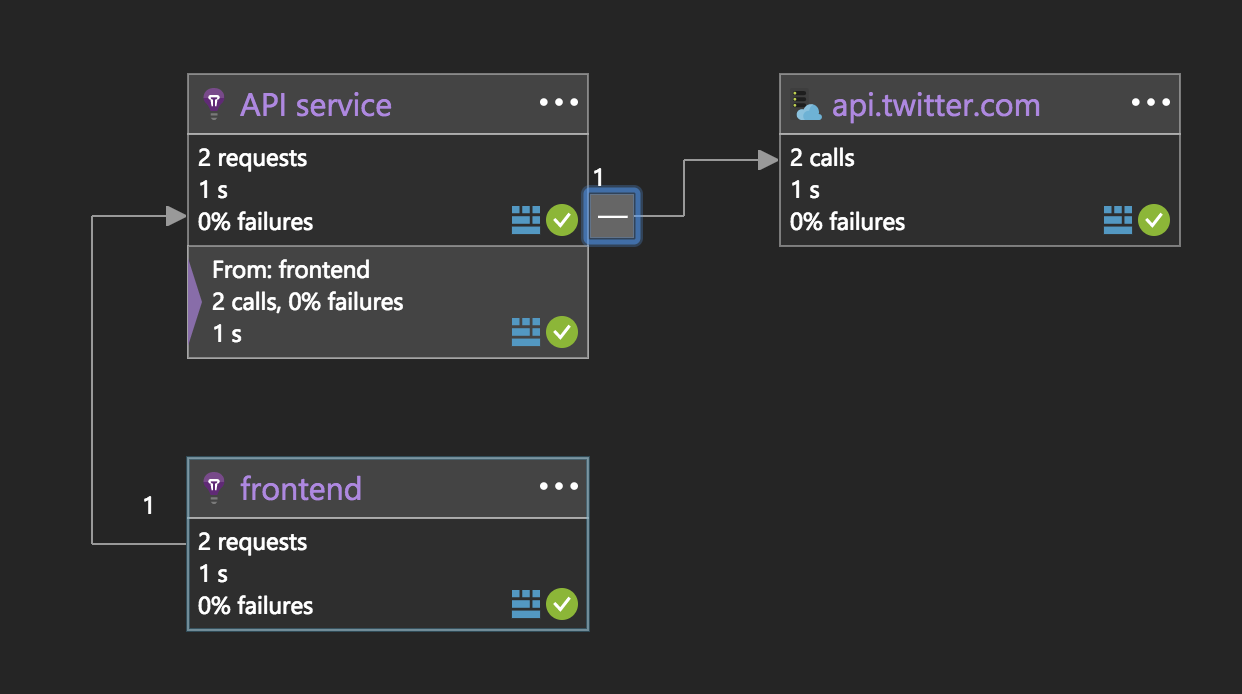
This picture shows how application map looks like:
Future directions
There are many improvements coming in the Application Insights distributed applications monitoring story. Specifically for Application Map we are working on optimizing join queries and speed up the map rendering. Application Map is more reliable with metric pre-aggregations. There will be advanced filtering and grouping capabilities to slice and dice the map.
Comments
comments powered by Disqus