Clone Application Insights Dashboard for a different application
You may have many environments where your application is running. For every environment you will create a separate Application Insights resource so you can set up access and billing for the production telemetry differnetly from the QA environment. However you may want to have the same dashboard for every environment. You may even want to deploy the dashboard updates alongside the application deployment. So when your application exposes new telemetry - dashboard will visualize it.
This blog post explains how to clone the dashboard and retarget it to the different Application Insights component using Azure Resource Management (ARM).
Let’s say you have a Dashboard A for the component A and you want to create the same dashboard for component B. In my example I simply pinned the servers chart to the dashboard, but it may be way more advanced in your case.
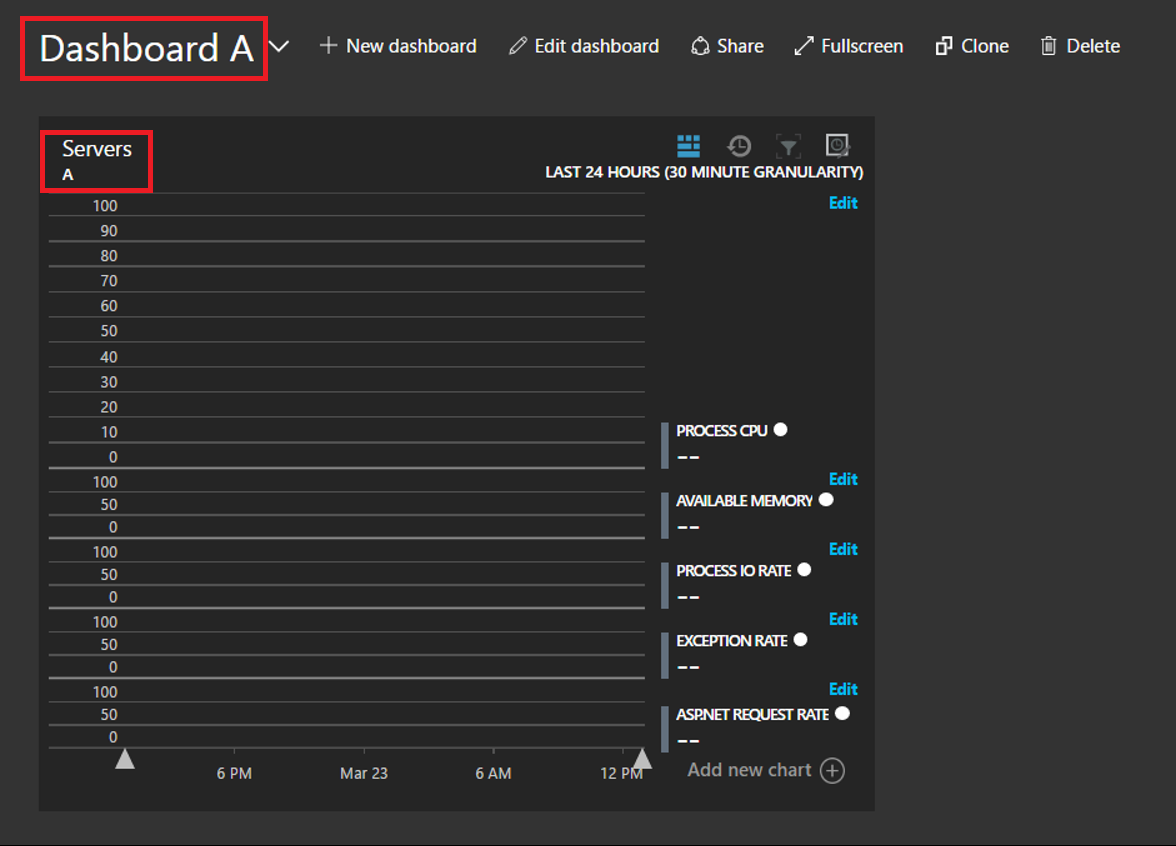
In order to clone the dashboard you need to share it first. Sharing places the dashboard definition into the resource group so you can see it in Azure Resource Management portal.
Once shared the URL for your dashboard will look like this: https://portal.azure.com/#dashboard/arm/subscriptions/6b984a40-aa54-452b-b975-acc3bf105fa7/resourcegroups/dashboards/providers/microsoft.portal/dashboards/7a2a64c5-a661-47c1-a1a3-afae823d7533. It includes subscription, resource group and dashboard unique name. Copy the dashbaord unique name (in this case 7a2a64c5-a661-47c1-a1a3-afae823d7533) and find it at https://resources.azure.com
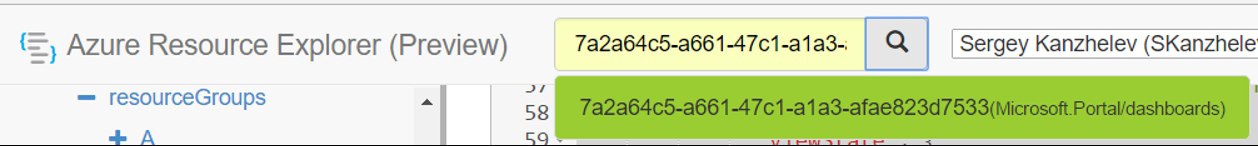
Direct URL to your dashboard definition will look like this: https://resources.azure.com/subscriptions/6b984a40-aa54-452b-b975-acc3bf105fa7/resourceGroups/dashboards/providers/Microsoft.Portal/dashboards/7a2a64c5-a661-47c1-a1a3-afae823d7533
Now you can copy the dashboard definition
{
  "properties": {
    "lenses": {
      "0": {
        "order": 0,
        "parts": {
          "0": {
            "position": {
              "x": 0,
              "y": 0,
              "rowSpan": 5,
              "colSpan": 6
            },
            "metadata": {
              "inputs": [
                {
                  "name": "ComponentId",
                  "value": {
                    "SubscriptionId": "6b984a40-aa54-452b-b975-acc3bf105fa7",
                    "ResourceGroup": "A",
                    "Name": "A"
                  }
                },
                {
                  "name": "MetricsExplorerJsonDefinitionId",
                  "value": "pinJson:?name={\n  \"version\": \"1.4.1\",\n  \"isCustomDataModel\": false,\n  \"items\": [\n    {\n      \"id\": \"b2f8708b-4a48-4b35-b96e-7622caca21ce\",\n      \"chartType\": \"Area\",\n      \"chartHeight\": 4,\n      \"metrics\": [\n        {\n          \"id\": \"performanceCounter.percentage_processor_time.value\",\n          \"metricAggregation\": \"Avg\",\n          \"color\": \"msportalfx-bgcolor-g0\"\n        }\n      ],\n      \"priorPeriod\": false,\n      \"clickAction\": {\n        \"defaultBlade\": \"SearchBlade\"\n      },\n      \"horizontalBars\": true,\n      \"showOther\": true,\n      \"aggregation\": \"Avg\",\n      \"percentage\": false,\n      \"palette\": \"blueHues\",\n      \"yAxisOption\": 0\n    },\n    {\n      \"id\": \"093583d1-bc86-4c2e-91d8-527a2411910b\",\n      \"chartType\": \"Area\",\n      \"chartHeight\": 1,\n      \"metrics\": [\n        {\n          \"id\": \"performanceCounter.available_bytes.value\",\n          \"metricAggregation\": \"Avg\",\n          \"color\": \"msportalfx-bgcolor-j1\"\n        }\n      ],\n      \"priorPeriod\": false,\n      \"clickAction\": {\n        \"defaultBlade\": \"SearchBlade\"\n      },\n      \"horizontalBars\": true,\n      \"showOther\": true,\n      \"aggregation\": \"Avg\",\n      \"percentage\": false,\n      \"palette\": \"greenHues\",\n      \"yAxisOption\": 0\n    },\n    {\n      \"id\": \"03fd5488-b020-417b-97e2-bf7564568d3b\",\n      \"chartType\": \"Area\",\n      \"chartHeight\": 1,\n      \"metrics\": [\n        {\n          \"id\": \"performanceCounter.io_data_bytes_per_sec.value\",\n          \"metricAggregation\": \"Avg\",\n          \"color\": \"msportalfx-bgcolor-g0\"\n        }\n      ],\n      \"priorPeriod\": false,\n      \"clickAction\": {\n        \"defaultBlade\": \"SearchBlade\"\n      },\n      \"horizontalBars\": true,\n      \"showOther\": true,\n      \"aggregation\": \"Avg\",\n      \"percentage\": false,\n      \"palette\": \"blueHues\",\n      \"yAxisOption\": 0\n    },\n    {\n      \"id\": \"c31fd4cc-be41-449e-a657-d16d2e9c8487\",\n      \"chartType\": \"Area\",\n      \"chartHeight\": 1,\n      \"metrics\": [\n        {\n          \"id\": \"performanceCounter.number_of_exceps_thrown_per_sec.value\",\n          \"metricAggregation\": \"Avg\",\n          \"color\": \"msportalfx-bgcolor-d0\"\n        }\n      ],\n      \"priorPeriod\": false,\n      \"clickAction\": {\n        \"defaultBlade\": \"SearchBlade\"\n      },\n      \"horizontalBars\": true,\n      \"showOther\": true,\n      \"aggregation\": \"Avg\",\n      \"percentage\": false,\n      \"palette\": \"fail\",\n      \"yAxisOption\": 0\n    },\n    {\n      \"id\": \"8b942f02-ef58-46ac-877a-2f4c16a17a4f\",\n      \"chartType\": \"Area\",\n      \"chartHeight\": 1,\n      \"metrics\": [\n        {\n          \"id\": \"performanceCounter.requests_per_sec.value\",\n          \"metricAggregation\": \"Avg\",\n          \"color\": \"msportalfx-bgcolor-b2\"\n        }\n      ],\n      \"priorPeriod\": false,\n      \"clickAction\": {\n        \"defaultBlade\": \"SearchBlade\"\n      },\n      \"horizontalBars\": true,\n      \"showOther\": true,\n      \"aggregation\": \"Avg\",\n      \"percentage\": false,\n      \"palette\": \"warmHues\",\n      \"yAxisOption\": 0\n    }\n  ],\n  \"title\": \"Servers\",\n  \"currentFilter\": {\n    \"eventTypes\": [\n      10\n    ],\n    \"typeFacets\": {},\n    \"isPermissive\": false\n  },\n  \"jsonUri\": \"MetricsExplorerPinJsonDefinitionId - Dashboard.f9bfee41-bd32-47a7-ae11-7d2038cd3c44 - Pinned from 'AspNetServersMetrics'\"\n}"
                },
                {
                  "name": "BladeId",
                  "value": "Dashboard.f9bfee41-bd32-47a7-ae11-7d2038cd3c44"
                },
                {
                  "name": "TimeContext",
                  "value": {
                    "durationMs": 86400000,
                    "createdTime": "2017-03-23T19:54:01.552Z",
                    "isInitialTime": false,
                    "grain": 1,
                    "useDashboardTimeRange": false
                  }
                },
                {
                  "name": "Version",
                  "value": "1.0"
                },
                {
                  "name": "DashboardTimeRange",
                  "value": {
                    "relative": {
                      "duration": 1440,
                      "timeUnit": 0
                    }
                  },
                  "isOptional": true
                }
              ],
              "type": "Extension/AppInsightsExtension/PartType/MetricsExplorerOutsideMEBladePart",
              "settings": {},
              "viewState": {
                "content": {}
              },
              "asset": {
                "idInputName": "ComponentId",
                "type": "ApplicationInsights"
              }
            }
          }
        }
      }
    },
    "metadata": {
      "model": {
        "timeRange": {
          "value": {
            "relative": {
              "duration": 24,
              "timeUnit": 1
            }
          },
          "type": "MsPortalFx.Composition.Configuration.ValueTypes.TimeRange"
        }
      }
    }
  },
  "id": "/subscriptions/6b984a40-aa54-452b-b975-acc3bf105fa7/resourceGroups/dashboards/providers/Microsoft.Portal/dashboards/7a2a64c5-a661-47c1-a1a3-afae823d7533",
  "name": "7a2a64c5-a661-47c1-a1a3-afae823d7533",
  "type": "Microsoft.Portal/dashboards",
  "location": "centralus",
  "tags": {
    "hidden-title": "Dashboard A"
  }
}
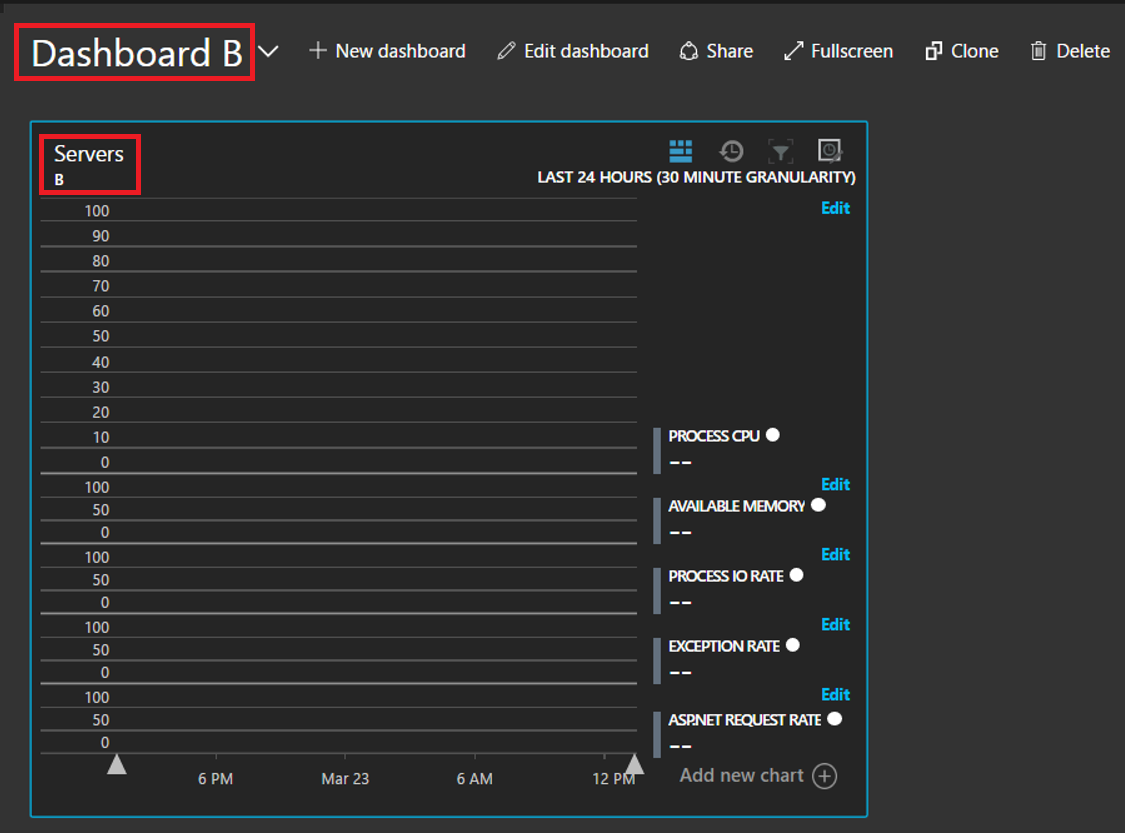
In order to retarget the dashboard just find all mentions of your Application Insights component and replace it to the new component. In my example there were only one mention:
"inputs": [
{
    "name": "ComponentId",
    "value": {
        "SubscriptionId": "6b984a40-aa54-452b-b975-acc3bf105fa7",
        "ResourceGroup": "B",
        "Name": "B"
    }
},.
Then rename the dashboard:
"id": "/subscriptions/6b984a40-aa54-452b-b975-acc3bf105fa7/resourceGroups
                    /dashboards/providers/Microsoft.Portal/dashboards/DashboardB",
"name": "DashboardB",
"type": "Microsoft.Portal/dashboards",
"location": "centralus",
"tags": {
    "hidden-title": "Dashboard B"
}
You can create the new dashboard in the ARM portal now. Type “DashboardB” as {Resource Name} and updated JSON as definition.
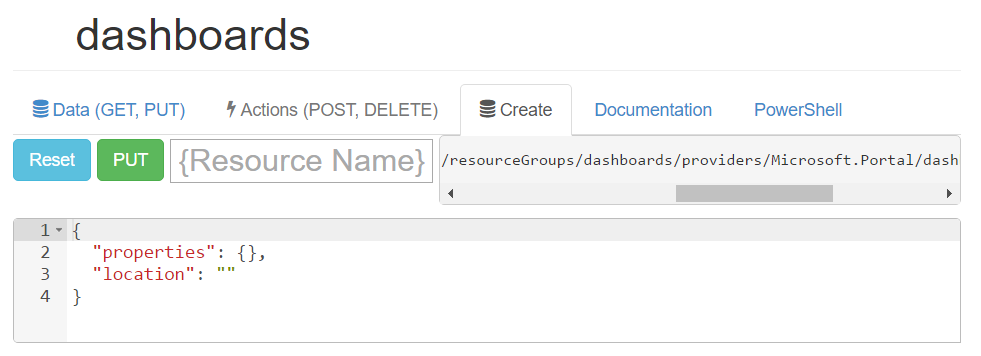
and start using your dashboard in the portal. Note, one perk of creating the dashboard manually is that the unique name of the dashboard you created is human readable, not the guid: https://portal.azure.com/#dashboard/arm/subscriptions/6b984a40-aa54-452b-b975-acc3bf105fa7/resourcegroups/dashboards/providers/microsoft.portal/dashboards/dashboardb
With Azure Resource Management you can automate this process and configure dashboards update/deployments alongside with the application. So the monitoring configuration will be a part of your service definition.
Comments
comments powered by Disqus