Deployments, scale ups and downs
I lost track of what deployed in staging slot of a cloud service once. I also was wondering how other people deploying that service. This post shows how you can answer questions like this using Application Insights Analytics queries.
The service I am looking at is deployed as two cloud services in different regions. It uses automatic code versioning using BuildInfo.config file. New version is deployed in staging slot and then VIP swapped into production.
As I said Application Insights is configured to report application version with every telemetry item. So you can group by application version and find when new version got deployed.
performanceCounters
| where timestamp >= ago(5d)
| where name == "Requests/Sec"
| summarize dcount(cloud_RoleInstance) by application_Version, bin(timestamp, 15m)
The query above detects deployments to staging, but it will not detect the VIP swap accurately. When VIP swap happens the same computers are running the same code. So the number of role instances reporting specific application version in the query above does not change. The only thing changes during the VIP swap is a virtual IP address of those computers.
I posted before how Application Insights will associate the IP address of incoming connection with the telemetry item if telemetry item by itself doesn’t have it specified. So all the performance counters will have client_IP field of the incoming connection. In case of cloud service it will be an IP address of the slot sending telemetry. Let’s use this fact and extend application_Version with the client_IP.
let interval = 5d;
performanceCounters
| where timestamp >= ago(interval)
| where name == "Requests/Sec"
| extend deployment = strcat(application_Version, " ", client_IP)
| summarize dcount(cloud_RoleInstance) by deployment, bin(timestamp, 5m)
| render areachart
This query gave me this picture:
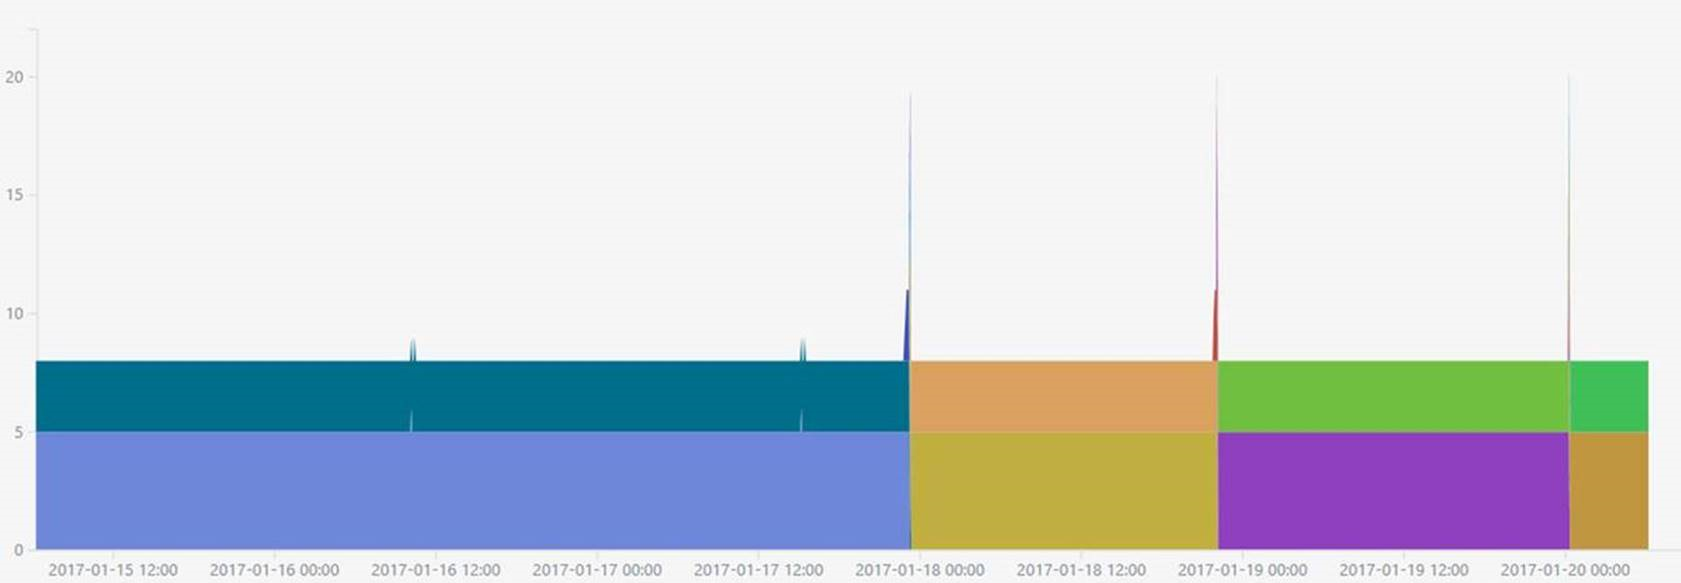
There are two regions this application is deployed to. Hence two general areas - 5 instances and 3 instances. You can also see the spikes when deployments were happening. You can also notice that staging slot doesn’t last long. Spike is very short. Turns out that the staging computers are shut down as part of a release procedure. Typically you would see scaled down number of staging computers running all the time to speed up the rollback when it’s needed.
Let’s zoom into the single deployment:
let fromDate = datetime(2017-01-18 21:50:00z);
let toDate = datetime(2017-01-18 22:15:00z);
performanceCounters
| where timestamp >= fromDate
| where timestamp <= toDate
| where name == "Requests/Sec"
| extend deployment = strcat(application_Version, " ", client_IP)
| summarize dcount(cloud_RoleInstance) by deployment, bin(timestamp, 1m)
| render areachart
The result is quite interesting:
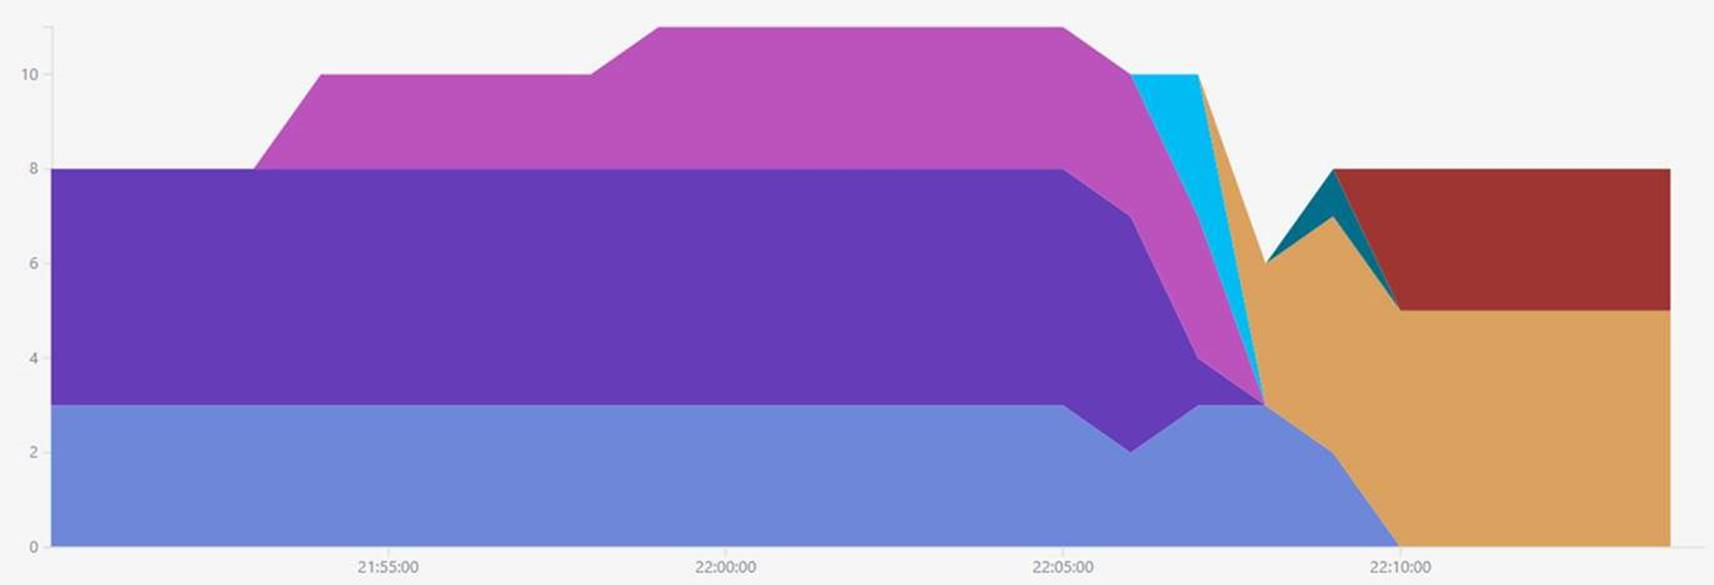
You can see the new version of an application deployed into the staging environment in one region and running for ~10 minutes. The same version was deployed in the staging of a different region for much shorter time. It seems that the production traffic started the application initialization after VIP swap. Which typically a bad practice, by the way. At least some smoke tests needs to be run against the staging slot to validate the configuration.
##Dig deeper
Analyzing the picture is not easy. Let’s modify the query to print out every deployment, scale up and scale down. Basically, we need to query for every time interval when the previous interval had a different number of role instances reporting the same application version.
Here is a query that returns number of instances per minute:
let query = (_fromDate:datetime, _toDate:datetime)
{
performanceCounters
| where timestamp >= _fromDate
| where timestamp <= _toDate
| where name == "Requests/Sec"
| summarize num_instances = dcount(cloud_RoleInstance)
    by application_Version, client_IP, bin(timestamp, 1m) };
You can call this query query(fromDate, toDate). Now let’s join it with the same results a minute back:
let fromDate = datetime(2017-01-18 21:50:00z);
let toDate = datetime(2017-01-18 22:15:00z);
let query = (_fromDate:datetime, _toDate:datetime)
{
  performanceCounters
    | where timestamp >= _fromDate
    | where timestamp <= _toDate
    | where name == "Requests/Sec"
    | summarize num_instances = dcount(cloud_RoleInstance)
        by application_Version, client_IP, bin(timestamp, 1m)
};
query(fromDate, toDate) | extend ttt = timestamp | join kind=leftouter
(
  query(fromDate - 1m, toDate + 1m) | extend ttt = timestamp + 1m
) on ttt, application_Version, client_IP
Note the use of leftouter join in the query. The only thing left is to filter the results and make it more human readable:
let fromDate = datetime(2017-01-18 21:50:00z);
let toDate = datetime(2017-01-18 22:15:00z);
let query = (_fromDate:datetime, _toDate:datetime)
{
performanceCounters
| where timestamp >= _fromDate
| where timestamp <= _toDate
| where name == "Requests/Sec"
| summarize num_instances = dcount(cloud_RoleInstance) by application_Version, client_IP, bin(timestamp, 1m) };
query(fromDate, toDate) | extend ttt = timestamp | join kind=leftouter (
query(fromDate - 1m, toDate + 1m) | extend ttt = timestamp + 1m
) on ttt, application_Version, client_IP
| project timestamp, before = num_instances1, after = num_instances, application_Version, client_IP
| where after != before
| extend name =
  strcat(
      iff(isnull(before), "Deployment", iff(after > before, "Scale Up", "Scale Down")),
      " in ",
      iff(client_IP == "52.175.18.0" or client_IP == "13.77.108.0", "Production", "Staging")
  )
| order by timestamp
The resulting table will look like this:
| timestamp | before | after | application_Version | client_IP | name |
|---|---|---|---|---|---|
| 2017-01-18T21:54:00Z | null | 2 | vstfs:///Build/Build/3562348 | 13.77.107.0 | Deployment in Staging |
| 2017-01-18T21:59:00Z | 2 | 3 | vstfs:///Build/Build/3562348 | 13.77.107.0 | Scale Up in Staging |
| 2017-01-18T22:06:00Z | 3 | 2 | vstfs:///Build/Build/3555787 | 52.175.18.0 | Scale Down in Production |
| 2017-01-18T22:07:00Z | 2 | 3 | vstfs:///Build/Build/3555787 | 52.175.18.0 | Scale Up in Production |
| 2017-01-18T22:07:00Z | 5 | 1 | vstfs:///Build/Build/3555787 | 13.77.108.0 | Scale Down in Production |
| 2017-01-18T22:07:00Z | null | 3 | vstfs:///Build/Build/3555787 | 13.77.107.0 | Deployment in Staging |
| 2017-01-18T22:08:00Z | null | 3 | vstfs:///Build/Build/3562348 | 13.77.108.0 | Deployment in Production |
| 2017-01-18T22:09:00Z | 3 | 5 | vstfs:///Build/Build/3562348 | 13.77.108.0 | Scale Up in Production |
| 2017-01-18T22:09:00Z | 3 | 2 | vstfs:///Build/Build/3555787 | 52.175.18.0 | Scale Down in Production |
| 2017-01-18T22:09:00Z | null | 1 | vstfs:///Build/Build/3555787 | 168.63.221.0 | Deployment in Staging |
| 2017-01-18T22:10:00Z | null | 3 | vstfs:///Build/Build/3562348 | 52.175.18.0 | Deployment in Production |
Using ad hoc analytical queries I found that deployments of this service can be improved. Smoke tests should be added for the staging deployment and staging machines should run for some time after deployment in case you’d need to VIP swap the deployment back.
Automatically detect deployments and scale up and downs may be useful in other scenarios. You may want to notify the service owner by writing a connector for your favorite chat platform. Or you can list the latest deployment to production and staging to know what and when was deployed. You can even report those deployments back to Application Insights as release annotation to see markers on charts. With the power of Analytical Queries in Application Insights it is easy to automate any of these scenarios.
Comments
comments powered by Disqus