Alerting over analytics queries
Update @ Feb 2019: I was asked to point to the fact, that this DYI project is not needed as this feature is supported natively by Azure Monitor.
This is DYI post on how you can use Availability Tests and Data Access API together to enable most popular requests in Application Insights uservoice.
Application Insights uservoce has these 4 very popular items. It is not hard to implement them yourself using Application Insights extensibility points.
- Application Insights alert rule custom events
- Add alerts based on results of Analytics Queries
- Support alerting on a segmented/filtered metric
- Add support for calculated metrics to App Insights
Let’s start with the alert on segmented metric. Let’s say I want to recieve alert when nobody opens any posts on this site. Posts differ from the default and about page by /blog/ substring in url. You can go to Application Insights Analytics and write a query like this to get the number of viewed posts:
pageViews
| where timestamp > ago(10min)
| where timestamp < ago(5min)
| where url !contains "/blog/"
| summarize sum(itemCount)
Note also that I’m using 5 minutes in the past to allow some time for data to arrive. Typical latency for the telemetry is under the minute. I’m being on a safe side here.
In order to convert this query into a Pass/Fail statement I can do something like this:
pageViews
| where timestamp > ago(10min)
| where timestamp < ago(5min)
| where url !contains "/blog/"
| summarize isPassed = (sum(itemCount) > 1)
| project iff(isPassed, "PASSED", "FAILED")
This query will return a single value PASSED or FAILED.
Now I can go to the query API explorer at dev.applicationinsights.io. Enter appId and API key and the query. You will get the URL like this:
GET /beta/apps/cbf775c7-b52e-4533-8673-bd6fbd7ab04a/query?query=pageViews%7C%20where%20timestamp%20%3E%20ago(10min)%7C%20where%20timestamp%20%3C%20ago(5min)%7C%20where%20url%20!contains%20%22%2Fblog%2F%22%20%7C%20summarize%20isPassed%20%3D%20(sum(itemCount)%20%3E%201)%7C%20project%20iff(isPassed%2C%20%22PASSED%22%2C%20%22FAILED%22) HTTP/1.1
Host: api.applicationinsights.io
x-api-key: 8083guxbvatm4bq7kruraw8p8oyj7yd2i2s4exnr
Instead of a header you can pass api key as a query string parameter. Use the parameter name &api_key. Resulting URL will look like this:
https://api.applicationinsights.io/beta/apps/cbf775c7-b52e-4533-8673-bd6fbd7ab04a/query
?query=pageViews%7C%20where%20timestamp%20%3E%20ago(10min)%7C%20where%20timestamp%20%3C%20ago(5min)%7C%20where%20url%20!contains%20%22%2Fblog%2F%22%20%7C%20summarize%20isPassed%20%3D%20(sum(itemCount)%20%3E%201)%7C%20project%20iff(isPassed%2C%20%22PASSED%22%2C%20%22FAILED%22)
&api_key=8083guxbvatm4bq7kruraw8p8oyj7yd2i2s4exnr
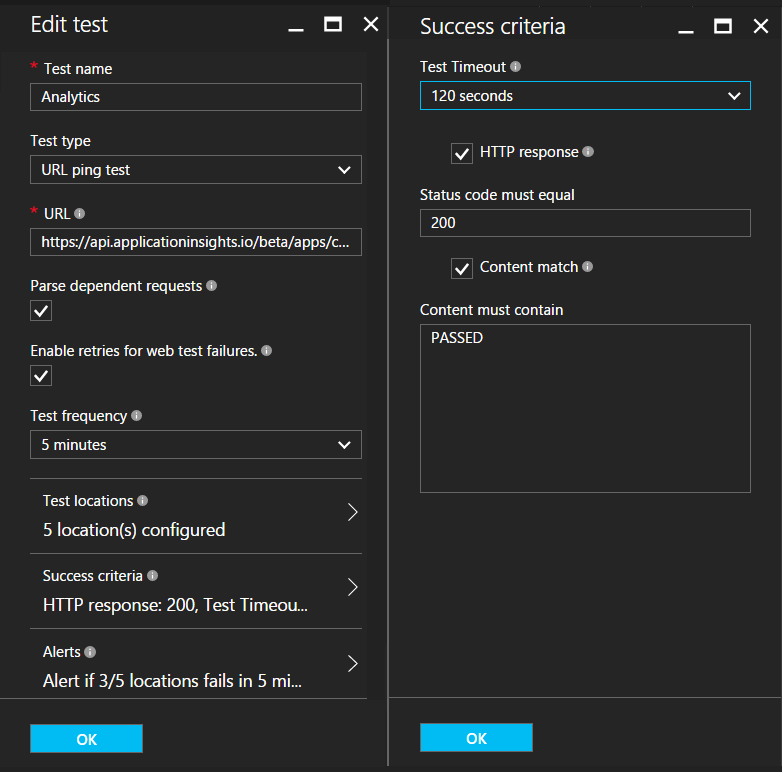
Final step will be to set up a ping test that will query this Url and make a content match success criteria to search for the keyword PASSED.

You can change queries to satisfy other requests. You can query customEvents by name same way as I queried pageViews by url. You can set an alert when CPU is very high at least on one instance instead of standard averge across all instances:
performanceCounters
| where timestamp > ago(10min) and timestamp < ago(5min)
| where category == "Process" and counter == "% Processor Time"
| summarize cpu_per_instance = avg(value) by cloud_RoleInstance
| summarize isPassed = (max(cpu_per_instance) > 80)
| project iff(isPassed, "PASSED", "FAILED")
You can also join multiple metrics or tables:
exceptions
| where timestamp > ago(10min) and timestamp < ago(5min)
| summarize exceptionsCount = sum(itemCount) | extend t = "" | join
(requests
| where timestamp > ago(10min) and timestamp < ago(5min)
| summarize requestsCount = sum(itemCount) | extend t = "") on t
| project isPassed = 1.0 * exceptionsCount / requestsCount > 0.5
| project iff(isPassed, "PASSED", "FAILED")
Some thoughts about this implementation:
- Availability tests runs once in 5 minutes from a single location. With 5 locations analytics query will run about every minute.
- The limit on number of analytics queries is 1500 per day. It allows to run a single ping test once a minute or more tests more rarely
- If query is too long you may need to use POST instead of GET. You can implement POST as multi-step test. But multi-step tests costs money. So you may be better off implementing a simple proxy that will run queries. Same way as I set certificate expiration monitoring.
Comments
comments powered by Disqus