Application Insights self-diagnostics
This blog post was written by Anastasia Baranchenkova
Each application insights component writes diagnostic information using EventSource.
If you see no data and you already checked that correct instrumentation key is specified you can try to use PerfView to see if there are problems with sending telemetry out (More about collecting Application Insights traces here.
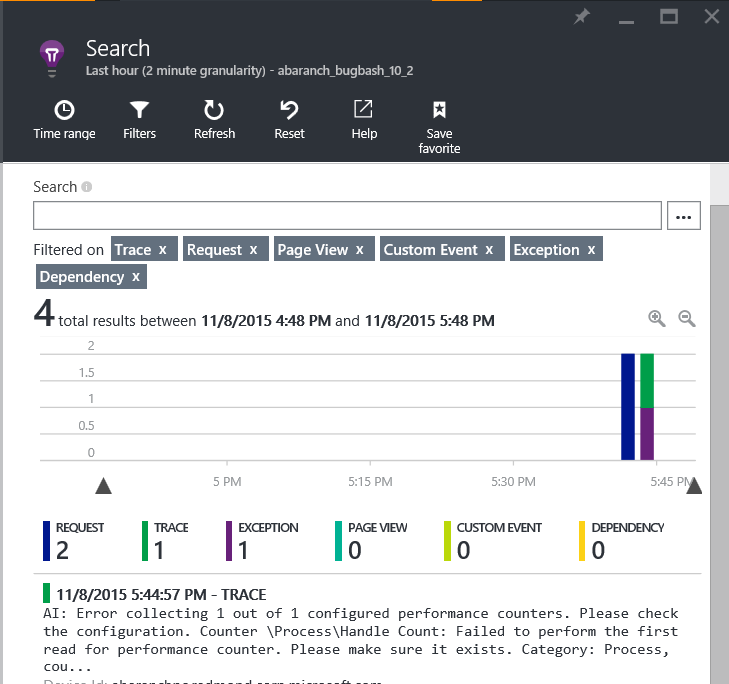
But it may be so that Application Insights is partially functional: channel is working and sending telemetry out but not all events are delivered. For example, you configured custom counter but you do not see it. If counter is configured incorrectly ETW event will be logged and you will actually be able to find Application Insights trace telemetry it in your Search explorer:
Why did you get this even as trace telemetry?
Application Insights Web nuget package adds Diagnostics module in the configuration file by default. This module subscribes to Application Insights diagnostic error events and sends them out to the same Application Insights resource that is used by your application. Diagnostics messages will be sent as trace telemetry and will have “AI:” or “AI Internal:” prefixes.
You can send Application Insights diagnostic messages to a different resource if you provide different instrumentation key for Diagnostics Module in your application insights configuration file:
<Add Type="Microsoft.ApplicationInsights.Extensibility.Implementation.Tracing.DiagnosticsTelemetryModule, Microsoft.ApplicationInsights" >
	<DiagnosticsInstrumentationKey>YOUR_KEY_2</DiagnosticsInstrumentationKey>
</Add>
UPDATE 1/31/16: Recently I’ve been asked several times about other override property that this module has: Severity. Updating this propety can force the diagnostics module to send all the telemetry to the portal and not only errors. I was not thinking that it is very useful for the end user but apparently it is e.g. when you cannot install Fiddler or PerfView on the production box. With this override you can collect verbose traces just by updaing the applicationinsights.config and restarting the application. Important! You do not want this to be enabled by default all the time! It decreases application performance, produces a lot of noice messages that you do not understand and for which you potentially pay money. If you still want to see all the traces in the portal you would add this to your config:
<Add Type="Microsoft.ApplicationInsights.Extensibility.Implementation.Tracing.DiagnosticsTelemetryModule, Microsoft.ApplicationInsights" >
	<DiagnosticsInstrumentationKey>YOUR_KEY_2</DiagnosticsInstrumentationKey>
	<Severity>Verbose</Severity>
</Add>
Comments
comments powered by Disqus