Application Insights for desktop applications
Good news, we open sourced Application Insights SDK for .NET. For now, just shared part of it - devices and ASP.NET SDKs are coming soon. Internally we call it “Core SDK”. In this article I want to describe how to use this SDK to track usage and crashes of your desktop application.
Let’s say you have a simple WPF app that shows the temperature in the location you’ve specified using zip code:
public MainWindow()
{
	InitializeComponent();
}

private async void buttonClick_requestCurrentTemperature(object sender, RoutedEventArgs e)
{
	// get zip code from the text box
	var zip = zipTextBox.Text;

	HttpClient client = new HttpClient();
	var apiUrl = string.Format(
        "http://api.openweathermap.org/data/2.5/weather?units=metric&zip={0},us",
        zip);
	var result = await client.GetStringAsync(apiUrl);

	JObject o = JObject.Load(new JsonTextReader(new StringReader(result)));
	var temperature = o.SelectToken("main.temp").Value<float>();

	// display the temperature:
	label.Content = temperature.ToString();
}
From usage perspective you might be curious what zip code being used most often. It is easy to track with Application Insights. You’ll need to install Application Insights API NuGet. Than you initialize Application Insights. Since I only have one form in my applicaiton, I’ve created a private telemetry client that will be used in this WPF form:
private readonly TelemetryClient telemetryClient;

public MainWindow()
{
	TelemetryConfiguration config = TelemetryConfiguration.CreateDefault();
	config.InstrumentationKey = "Foo";
	telemetryClient = new TelemetryClient(config);

	InitializeComponent();
}
With this you can now track telemetry event every time somebody click the button:
telemetryClient.TrackEvent("TemperatureRequested",
	new Dictionary<string, string>() { { "zip", zip } });
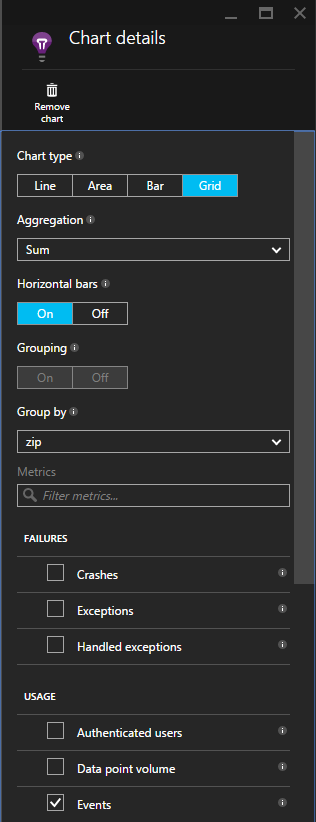
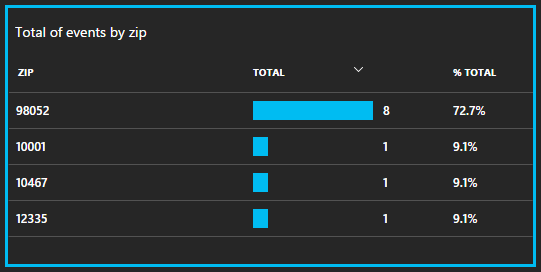
In the Azure portal you can open Metric Exporer and group events by zip code:
Once configured you’ll see a view like this that can be saved as favourite view for later access:
It was easy. Now let’s say you want to decide whether you need to show a spinner to your customer while she is waiting for results. You wonder - how long does it typically take to display the temperature.
Every event has a metrics collection you can associate with it. Just start a timer and report the duration as a metric. Now you can have charts showing the average duration for TemperatureRequested event. Code may look like this:
private async void buttonClick_requestCurrentTemperature(object sender, RoutedEventArgs e)
{
    var timer = Stopwatch.StartNew();
    var zip = zipTextBox.Text;

    try
    {
        HttpClient client = new HttpClient();
   		var apiUrl = string.Format(
               "http://api.openweathermap.org/data/2.5/weather?units=metric&zip={0},us",
               zip);
        var result = await client.GetStringAsync(apiUrl);

        JObject o = JObject.Load(new JsonTextReader(new StringReader(result)));
        var temperature = o.SelectToken("main.temp").Value<float>();

        label.Content = temperature.ToString();
    }
    finally
    {
        telemetryClient.TrackEvent("TemperatureRequested",
            new Dictionary<string, string>() { { "zip", zip } },
            new Dictionary<string, double>() { { "duration", timer.ElapsedMilliseconds } });
    }
}
Finally, you want to know how many users of your application clicking this button. So you need to start tracking users and sessions. In my application I’m creating the new session every time user opens the form. I’m using the user name from environment. You need to make sure that user names are unique enough so you’ll get the real number of users.
public MainWindow()
{
    TelemetryConfiguration config = TelemetryConfiguration.CreateDefault();
    config.InstrumentationKey = "954f17ff-47ee-4aa1-a03b-bf0b1a33dbaf";
    telemetryClient = new TelemetryClient(config);
    telemetryClient.Context.User.Id = Environment.UserName;
    telemetryClient.Context.Session.Id = Guid.NewGuid().ToString();

    InitializeComponent();
}
You can find more information on usage tracking on Application Insights documentation page.
Note, in this example I do not initialize singleton TelemetryConfiguration.Active and do not use ApplicationInsights.config configuration file. So in the documentation above you cannot just create TelemetryClient c = new TelemetryClient();. This telemetry client will not be initialized - it will not have instrumentaiton key and telemetry channel configured.
Most of the code above it not specific for desktop applications. One of the difference of desktop applications is that they may be running without internet connection. By default when you create TelemetryConfiguration in-memory channel will be used to communicate with the Application Insights backend. This channel has no persistence of events and will lose data if internet connection is not reliable. You may use this channel if it is not the issue for you. However for more reliable telemetry you may want to use persistence channel. For desktop applicaitons use Microsoft.ApplicationInsights.PersistenceChannel NuGet:
public MainWindow()
{
    TelemetryConfiguration config = TelemetryConfiguration.CreateDefault();
    config.InstrumentationKey = "954f17ff-47ee-4aa1-a03b-bf0b1a33dbaf";

    config.TelemetryChannel = new PersistenceChannel();
    config.TelemetryChannel.DeveloperMode = Debugger.IsAttached;

    telemetryClient = new TelemetryClient(config);
    telemetryClient.Context.User.Id = Environment.UserName;
    telemetryClient.Context.Session.Id = Guid.NewGuid().ToString();

    InitializeComponent();
}
Persistence channel is optimized for devices scenario when the number of events produced by application is relatively small and connection is unreliable quite often. This channel will write events to the disk into reliable storage first and then attempt to send it. Here is how it works.
Let’s say you want to monitor unhandled exceptions. You’d subscribe on UnhandledException event and in the corresponding callback you want to make sure that telemetry will be persisted. So you call Flush on telemetry client.
AppDomain.CurrentDomain.UnhandledException += CurrentDomain_UnhandledException;

...

private void CurrentDomain_UnhandledException(object sender, UnhandledExceptionEventArgs e)
{
    ExceptionTelemetry excTelemetry = new ExceptionTelemetry((Exception)e.ExceptionObject);
    excTelemetry.SeverityLevel = SeverityLevel.Critical;
    excTelemetry.HandledAt = ExceptionHandledAt.Unhandled;

    telemetryClient.TrackException(excTelemetry);

    telemetryClient.Flush();
}
The only thing method Flush will do is to make sure that all telemetry events from the buffer are stored in persistence storage. In my case when I enter incorrect zip code - applicaiton will crash with ArgumentExcetpion and I’ll see new file named 20150810005005_84fb4de977e24c8399618daf2c4eb57d.trn into the folder %LocalAppData%\Microsoft\ApplicationInsights\35eb39bd0bb5855e732748ad369ffacc10de7340.
This file has all events scheduled to be send to the backend compressed with GZIP.
https://dc.services.visualstudio.com/v2/track
Content-Type:application/x-json-stream
Content-Encoding:gzip

H4sIAAAAAAAEAN2YbW/bNhDH3w/YdzD0tjahR8sWkgCps6JZ4yyL3ebFXASUdLI5S5RKUk7cIN99R9mulYd5SR/UYMkbizqefve/I0/UjcFpBkZgDFkkcpknihwWRcoiqljOj7lk05mSpO+5ieUniesDuJRa1HTCMDFDizpOHNKE/LYAroy2oVjlzTYtr2P2OmZ/bPmBZwamR3pez7S7Tsf0A9NEU/YOlmi6cd3RvjvaeUd779Tda8d0Ko3gxqCMMK5AcJoSGc8/gJAIin4sYhOTeF2nj9ZoVUoQhMV4B39M55R/Xo1LkHrG6pYdU8tzqdfx+0jrdm2vE/a6Vsft22DaNPQ8yzRu20ZMFdVPD6mE8bLQIVYRH+nxdjV8tDZZgDACu73RdQxZAYKqUsA5fCpBKohxRgZU4lCGPqqw4lJUihuBY3n4wELkOE0xqO5+ZoVWqmd6dmzc4t+vv9x8r8RdR1BUT96dvL5t2v7/J3mbqHckcEZ5nEJ8qND+PV9foS1s5mJIf90YGsXCxDhmz8FI0f/pKjGjJeY6I4diWuo0n5ZpWhc7w1DoVBt+oGkJrYhynqtWCC2OlmQiJvyMCnSFerV0roOWzEsRgaHR5Bs0GikazY1AiRKwYqiQEK+HkCuFBaRGYOonqVmuBTuFK4XYulZ+l6jiCeOfsAAUcC2qJBWIFlpKyMJ0+XBKu7XO2b6P+cL/dmtQprq49zmUStC03TorQyxDrI9xPge+75g0dhPohjbtUkAFb9tf4KyXDGfX4C6KpLa6LDKkjF8wHudXr/bCUiHFAG/OL8VqiQ9KITDltbV/EF9eOmSYL+AUrtXdMO4534ZhPTUMXTHoM2HppviiYDLB6ismk3veHxnYBkOuaZaSSKKvlHH049s1QZyaIOviPi+53jTIIM8KfLgYgViwCCQ5lEseDSvr1yVLYxCDXMCrvYPo8vKIySKly0GKGthkbzwT+VVlfxCiSHe1yWSUi5SFW1Hcp4oS+j71Iq9r9R0XzF6/nlv3YSgrBSRBHKAx49Pt1nghaIGJJMfrvescaDqgleT1NK4cvMat5CtoHStMnJ7XpbHTdcHx6rTeV9GOxXJAVTS7mAFvirT7FFKdfw0G4o9qeegN/Zgv0PlxVjQmqv+NqHwEUSmYWg5yLIsHa/qHcfcecteLAKE05RpKL9BN1TaysPrPpWuEyjJfJpb1bTXYVMlZ9vM4yZnIsQnIP0u437J/IOQj7Wkn5AWPNefbPJ83xljvO8OR5nNs8vaKx5tNew3VGJD3b0CjMox0g64pplteiK+XX8qwMcontZUX066tJ7WWF9GvrUe6yc5FcwJTGi2b79ZW/z8LdfOj4SVkm4+RveeSJvgyrtgCVq/B25U0XJ/8mgJ8ZpchZ6WcvdEnzyYTbD+7x2woGyPc0WBqByr99rDFvAt3JkDiubCyq9ivcjH/3pg7zjb3MB9/M2wEcseR5h7kT4Db0W5+Ppy/47MEXlSfJl7W94U8/HsyOYKwnE4mmnCqvzDcfrz92DYkBqXPUCer4IwBXuDEVH/k/AeYVOh5mxYAAA==
Next time you’ll start this application - channel will pick up this file and deliver telemetry to the Application Insights.
All the implementation details of this telemetry configuration you may find on github.
There are many more aspect of desktop applications monitoring. I didn’t explain how you will track page views - one of the main concept of devices monitoring. You may also want to track failures, collect diagnostics logs or track dependencies and performance counters. Maybe next time I can cover these aspects as well.
Comments
comments powered by Disqus