Collect ASP.NET MVC Web API traces with Application Insights
Application Insights is designed to be a continuation of development expirience. As you use traces for development it is very easy to start collecting traces for your application in production. Today I’ll walk thru steps to enable traces collection using Application Insights.
I’m going to demo how to enable System.Diagnotsics traces. One may argue that those traces are not very efficient and will be absolutely correct. There are many tracing libraries that are faster and more powerful. However there are lots of libraries out wild which already instrumented with this tracing framework. One of example is Web API tracing library.
Traced from ASP.NET Web API
Let’s take a simple Web API application. I created one using File->New dialog in VS 2013. Following the steps in this article we will enable tracing by installing package
PM> Install-Package Microsoft.AspNet.WebApi.Tracing
and then modifying WebApiConfig.cs by adding call to extension method defined in that nuget package:
config.EnableSystemDiagnosticsTracing();
You may already have Application Insights enabled for your application. If not just follow instructions. Now you are ready to enable traces collection from your application. Enabling tracing is very easy. Just install the nuget:
PM> Install-Package Microsoft.ApplicationInsights.TraceListener -Pre
Under the hood nuget will add reference to new assembly containing trace listener and add this trace listener into web.config:
<system.diagnostics>
<trace autoflush="true" indentsize="0">
  <listeners>
    <add name="myAppInsightsListener" type="Microsoft.ApplicationInsights.TraceListener.ApplicationInsightsTraceListener, Microsoft.ApplicationInsights.TraceListener" />
  </listeners>
</trace>
</system.diagnostics>
Now when you running Web API methods you will not only see those methods as requests, but also traces associated with these requests. On my machine I just run application under debugger and called this GET method “http://localhost:57444/api/values” from browser. Here are result I see in azure portal:
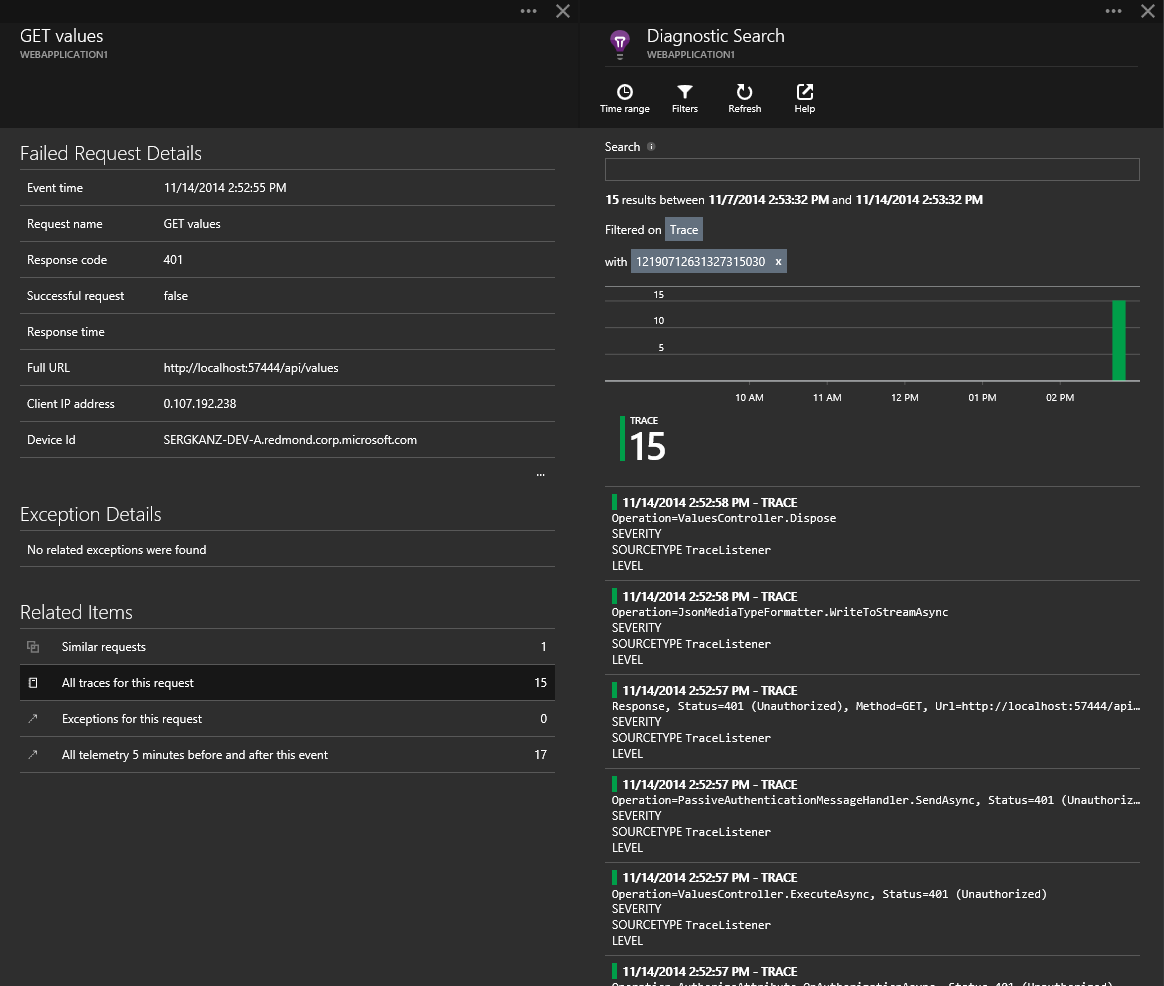
You see step by step execution of Web API pipeline - in the portal traces are in reverse order:
Request, Method=GET, Url=http://localhost:57444/api/values, Message='http://localhost:57444/api/values'
Message='Values', Operation=DefaultHttpControllerSelector.SelectController
Message='WebApplication1.Controllers.ValuesController', Operation=DefaultHttpControllerActivator.Create
Message='WebApplication1.Controllers.ValuesController', Operation=HttpControllerDescriptor.CreateController
Message='Selected action 'Get()'', Operation=ApiControllerActionSelector.SelectAction
Message='The authentication filter did not encounter an error or set a principal.', Operation=HostAuthenticationFilter.AuthenticateAsync
Message='Will use same 'JsonMediaTypeFormatter' formatter', Operation=JsonMediaTypeFormatter.GetPerRequestFormatterInstance
Operation=HostAuthenticationFilter.ChallengeAsync
Message='Selected formatter='JsonMediaTypeFormatter', content-type='application/json; charset=utf-8'', Operation=DefaultContentNegotiator.Negotiate
Operation=AuthorizeAttribute.OnAuthorizationAsync, Status=401 (Unauthorized)
Operation=ValuesController.ExecuteAsync, Status=401 (Unauthorized)
Operation=PassiveAuthenticationMessageHandler.SendAsync, Status=401 (Unauthorized)
Response, Status=401 (Unauthorized), Method=GET, Url=http://localhost:57444/api/values, Message='Content-type='application/json; charset=utf-8', content-length=unknown'
Operation=JsonMediaTypeFormatter.WriteToStreamAsync
Operation=ValuesController.Dispose
This it pretty cool, all existing traces will be sent to Application insights, indexed and sliced by requests and sessions. For every request you will see all troubleshooting informaiton. No more remote desktop to production server to get traces from the local file!
Named trace providers
Once installed Application Insights listen for default trace source. However your trace source may be named. In this case you’ll need to adjust configuration. Here is how to enable Application Insights tracing to listen for System.Net trace source (and shoot yourself in the foot ;-)). I haven’t planned that shooting part of this example. Let me explain what I did.
First, I moved Application Insights trace listener to sharedListeners section and added System.Net trace source. Here is how web.config looks like after my change:
<system.diagnostics>
<trace autoflush="true" indentsize="0">
  <listeners>
    <add name="myAppInsightsListener" />
  </listeners>
</trace>
<sources>
  <source name="System.Net" switchName="sourceSwitch" tracemode="includehex" maxdatasize="1024">
    <listeners>
      <add name="myAppInsightsListener" />
      <remove name="Default"/>
    </listeners>
  </source>
</sources>
<switches>
  <add name="sourceSwitch" value="Information"/>
</switches>
<sharedListeners>
  <add name="myAppInsightsListener" type="Microsoft.ApplicationInsights.TraceListener.ApplicationInsightsTraceListener, Microsoft.ApplicationInsights.TraceListener" />
</sharedListeners>
</system.diagnostics>
Then I modified my applciaiton to make a simple call to bing:
var request = (HttpWebRequest)WebRequest.Create(new Uri("http://bing.com"));
using (var stream = new StreamReader(request.GetResponse().GetResponseStream()))
{
    stream.ReadToEnd();
}
And finally I started my application and… wait for it… got throttled on Application Insights endpoint. You can see 5 requests and 1.2K traces:
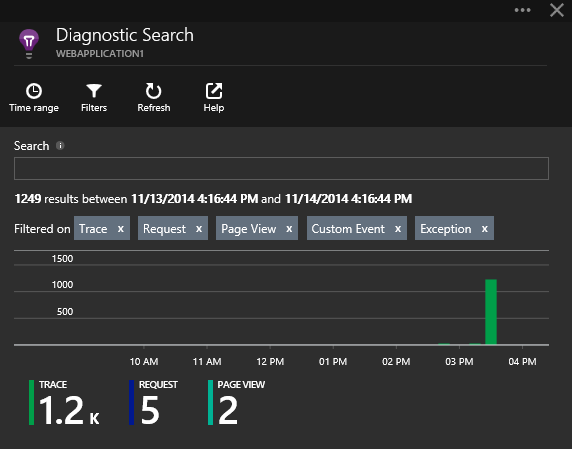
I looked at couple traces and quickly realized that I fall into recursion. First request to application was collected and generated Application Insights data item. This data item was compressed and sent to Application Insights using http call. This http call produced tons of traces (System.Net is quite chatty trace source). Those traces in turn were grouped into bunch, compressed and… sent using http that produced more http traces. In fact I was throttled even before a call to bing.com was traced ;-). Here is a trace message that helped me figure this out:
[1520] HttpWebRequest#65064868 - Request: POST /v2/track HTTP/1.1
One of the reasons why it happened is that in Visual Studio Application Insights works in “developer mode” that ensure data items are sent to portal really quick so you can see your telemetry data almost instantaneously.
Summary
It is very easy to collect traces using Application Insights. However it is important to be cautious of tracing level you configured.
Comments
comments powered by Disqus